
Right on track?
Right on track?
Tough year in the markets, but is the market where it should be?

For much of this year I’ve written articles and emails to clients about the direction of the market. 2022 has been a tough year and the S&P 500 is still down ~21% year-to-date and down a little more than 18% over the past 52 weeks.
Feeling some anxiety after that introduction?
Let’s look at returns over time.
According to the S&P 500 Data at www.officialdata.org:
“If you invested $100 in the S&P 500 at the beginning of 1900, you would have about $8,841,499.96 at the end of 2022, assuming you reinvested all dividends. This is a return on investment of $8,841,399, or 9.72% per year.”
I recently saw something similar on Twitter:

Looking at the chart, it’s one of the most helpful trend lines I’ve seen this year. Using my trusty HP 10bII+, I calculated the same factors and verified the math checks out. I also asked Jordan for permission to use this example and he kindly obliged. Give Jordan a follow here.
Five year trend line
I wanted to see this trend line updated with the most recent week of trading captured. The chart below goes back to November 2017; each candlestick represents a full week of trading. Not looking too much at patterns or other technical factors here, but you can see a couple of instances where this trend line provided either support or resistance over that period of time. Resistance at this line was certainly evident over the past two weeks of trading.
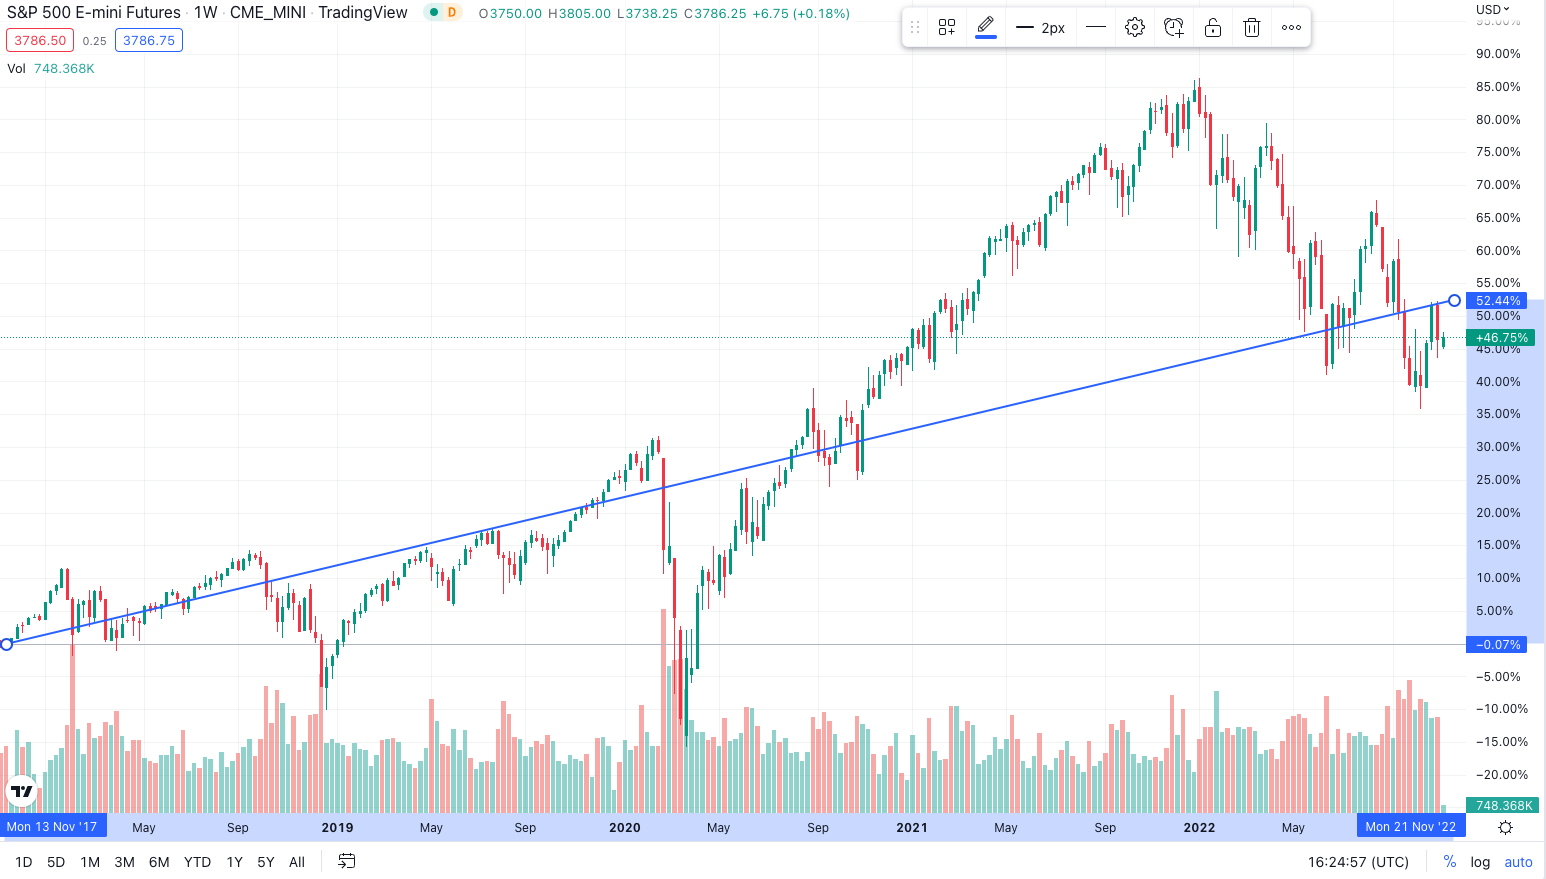
One important note about trend lines: depending on where you draw them, you can communicate a variety of messages. I drew this trend line to where the market last had a recent week of highs, which was the week of October 24. The market then fell from that level the very next week. Based on those recent highs, the market was up 52.44% since the November 2017 starting point.
Here’s the math for that level: $1 invested over 5 years and reaching a total return of 52.44% would indicate an average annual return of about 9.08%.
If I use the level where the market is so far for the week of November 7th, the math would be: $1 invested over 5 years and reaching a total return of 47.11% would indicate an average annual return of about 8.03%.
Still, not too shabby for an annual return, especially when you factor in all the periods of volatility occurring over the past 5 years.
Volatility since 2017
Just look at the chart - there are multiple times the red bars win. Much of 2018 was no fun, particularly in 3Q & 4Q where the bottom kind of fell out heading into the holidays. The first trading day after Christmas that year saw a massive bounce to the upside, which started the next leg of an uptrend. 2019 was rather ho-hum with the market trying to climb back over the trend line.
March 2020 ended the uptrend that began on December 26, 2018, retesting and breaking through the 2018 lows. The V-shaped recovery brought the market back up to February 2020 levels.
Then there’s 2021. Look how high the market ran above the trend line. At the peak, which was the week of December 27, 2021, the market return if following that same trend line would have been 42.67%. Instead, it peaked that week at 84.89%.
84.89%! That’s almost 100% above trend.
Naturally, that kind of run was neither substantive nor sustainable. Much of what drove the markets in 2021 were completely disconnected from reality in a lot of respects and for a lot of reasons that I won’t go into with this post.
Now, here we are midway through 4Q 2022. Being right on top of the midterm elections, a potential looming recession, high gas prices, persistently high inflation, Fed interest rate hikes, and all kinds of other distractions, the market seems to be showing some resilience. There’s still what appears to be a downward trend line for the year… but, still bouncing around the steady long-term upward trend line you see on the chart.
What investment game are you playing?
It’s easy to get excited about gains and scared about losses. As I’ve written a few times this year, you have to know what game you’re playing so you set an objective and can follow the right set of rules before making investment decisions. Especially in periods of volatility!
If you’re playing a game that doesn’t put a lot of time on the clock, you will have to approach investing far different than someone playing a game where there’s plenty of time to score. This is exactly like sports: the 2-minute drill playbook when you’re down a score is different than the playbook when it’s the 1st quarter and you’re down a score.
Either way, chances are this 2022 period will represent a price correction to get back to the average trend line. Or as it’s called in technical analysis, a reversion to the mean.
I really don’t see a healthy scenario where the market gets back to even for this year, and I think 2023 will be a year where the market continues to regroup and recover, unless there’s a significant negative reaction to any number of given events and we experience a stagnant economy or even a recession. Even if there’s more volatility ahead - and there always is - keep playing the right investment game for you, with an eye on that long-term trend line.
Disclosures
Life Moves Wealth Management is a registered investment advisor offering advisory services in the States of Arizona and Indiana, and in other jurisdictions where exempted. Registration does not imply a certain level of skill or training. Information contained on this site should not be considered a solicitation to buy, an offer to sell, or a recommendation of any security in any jurisdiction where such offer, solicitation, or recommendation would be unlawful or unauthorized.
The information on this site is not intended as tax, accounting or legal advice, as an offer or solicitation of an offer to buy or sell, or as an endorsement of any company, security, fund, or other securities or non-securities offering. This information should not be relied upon as the sole factor in an investment making decision. Past performance is no indication of future results. Investment in securities involves significant risk and has the potential for partial or complete loss of funds invested. It should not be assumed that any recommendations made will be profitable or equal any performance noted on this site.
HYPERLINK DISCLOSURE – The information being provided is strictly as a courtesy/convenience. When you link to any of the web sites provided here, you are leaving this website and assume total responsibility and risk for use of the web sites you are visiting. We make no representation as to the completeness or accuracy of information provided at these websites. Life Moves Wealth Management is not liable for any direct or indirect technical or system issues or any consequences arising out of your access to or your use of third-party technology, web sites, information and programs made available through this website. Life Moves Wealth Management does not make any representations or warranties as to the accuracy, timeliness, suitability, completeness, or relevance of any information prepared by any unaffiliated third party, whether linked to Life Moves Wealth Management’s web site or incorporated herein, and takes no responsibility thereof.